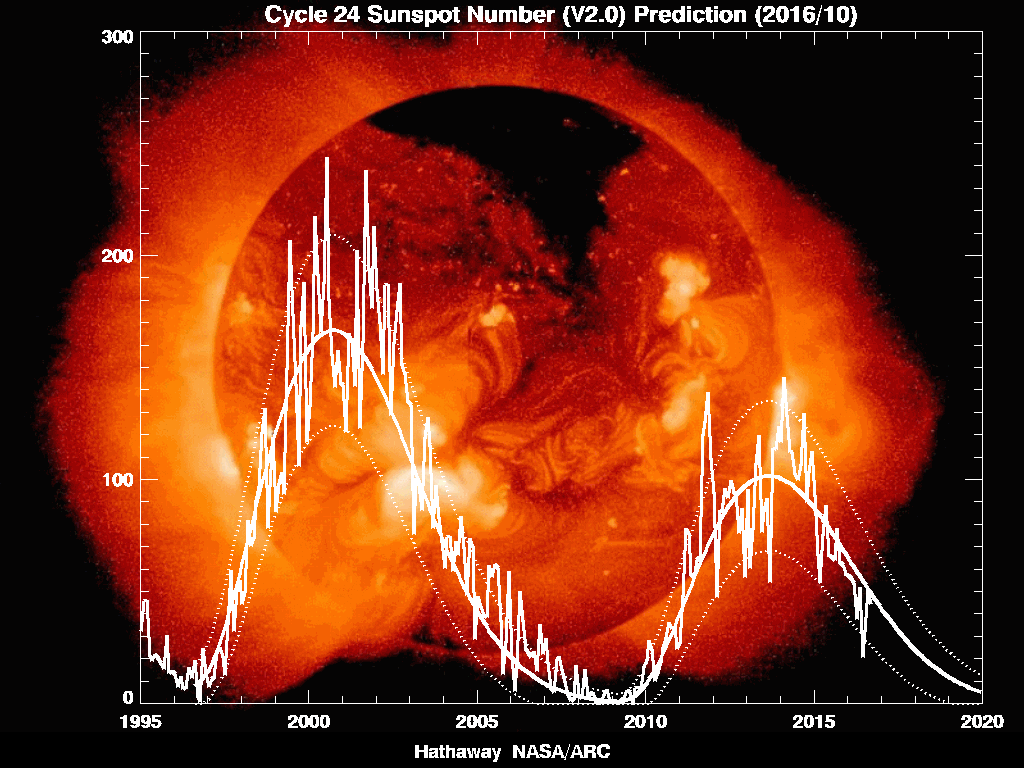
 The image above is the most recent prediction of sunspot activity from NASA. The graph below is NASA's prediction circa March 2006. Notice any differences? Cycle 24 has produced only a few minor sunspots and solar activity has been well below the predicted amount for years. In fact, a recent paper published by the Astronomical Society of Australia warns we are now in danger of global cooling.
Commentary on economics and other matters of concern to capitalists.
A Tale of Two Graphs
Subscribe to:
Post Comments (Atom)
Blog Archive
-
▼
2008 (61)
-
▼
July (28)
- Venter Hopes For Fourth Generation Biofuel This Year
- Coalition Deaths Continue to Decline in Iraq
- Craig Venter's Fourth Generation Biofuels From Algae
- PetroAlgae's Centrifuge Oil Extraction Method
- Ride The Lightning
- Plasma Gasification
- Fuel From Algae By Gasification
- Headmaster Makes Algae Gasoline for $1.90 a Gallon
- Solazyme's Sugar Eating Algae
- Boeing Bullish on Biofuel from Algae
- Ford to Manufacture European Cars in America
- Jesse Jackson Paved The Way For Osama bin Laden?
- There Is No Consensus On Global Warming
- Oil From Algae at Half the Cost of Fossil Oil
- What is More Cost Effective, Algae or Bacteria Fuel?
- The Pickens Plan
- LS9 Makes Oil from Bugs at $125 a Barrel
- Sequesco's Grow in the Dark Synthetic Super Bugs
- A Tale of Two Graphs
- Hydrogen from Algae at MIT.
- 12,000 gallons of algae in 3 days?
- Quantum Fracturing
- C02 Bioreactors
- Thermometers Not Cooperating With Global Warming
- Global Warming: The Anti-Capitalism
- Wall Street Journal On Scum Power
- Investment in Renewable Energy Skyrockets
- Vertical Algae Bioreactor
-
▼
July (28)


0 comments:
Post a Comment